qgis2web WIKI
First steps
Installation
- In QGIS, select
Plugins > Manage and Install Plugins... - Find
qgis2web
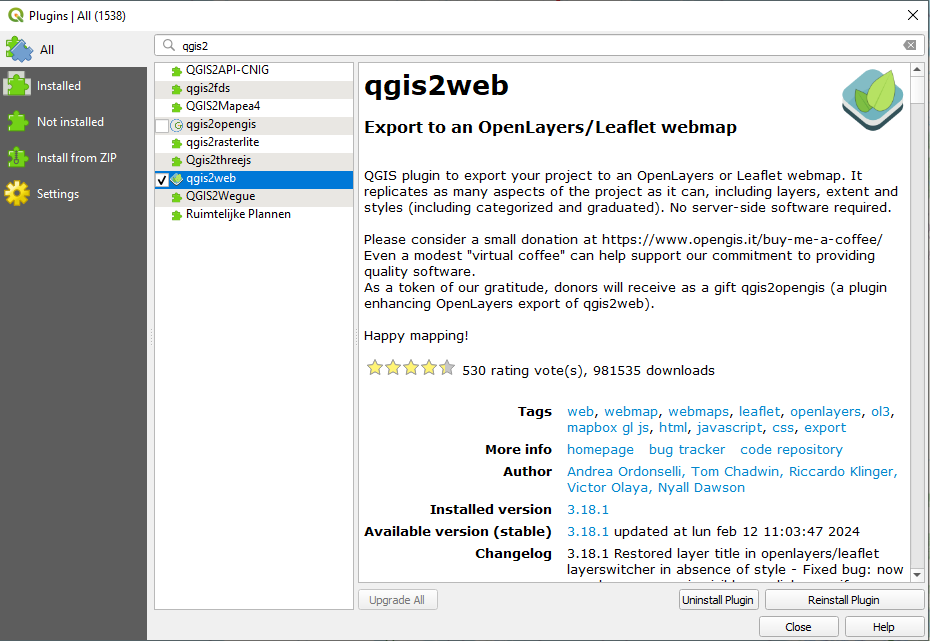
Click
Install pluginor:
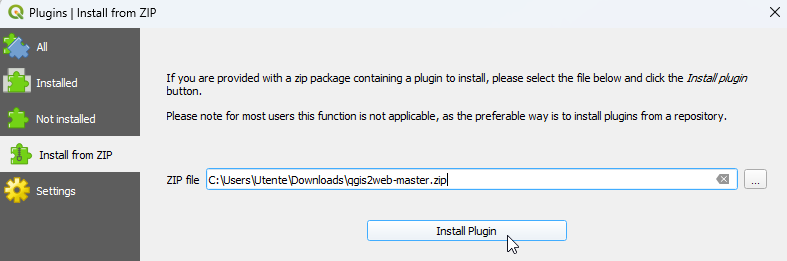
- Download master repository from github
- In QGIS, open
Plugins > Manage and Install Plugins... > Install from ZIP
Usage
Prepare your QGIS map with simple symbologies. You can improve your webmap like this:
- Set your project title, abstract, background and highlight colours in
Project > Properties... > General/Metadata - Give your layers human-friendly names in
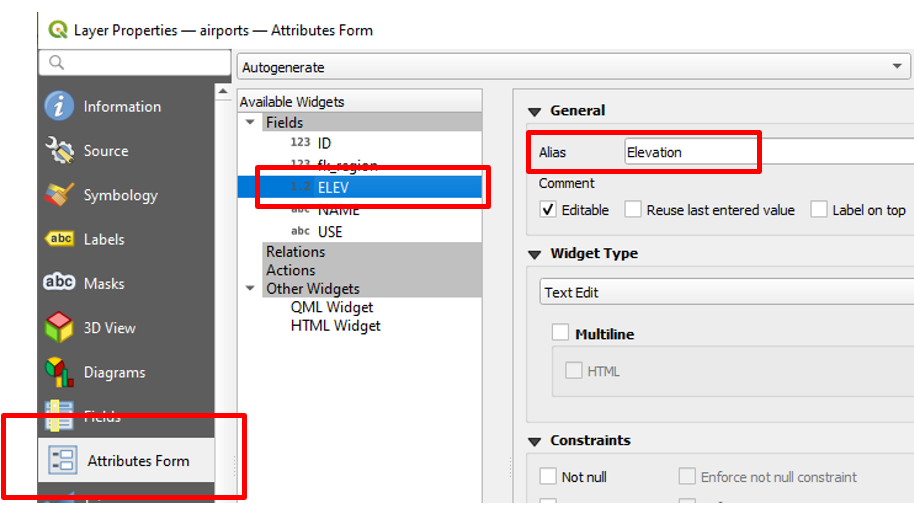
Layers Panel - Give your layer columns human friendly names via
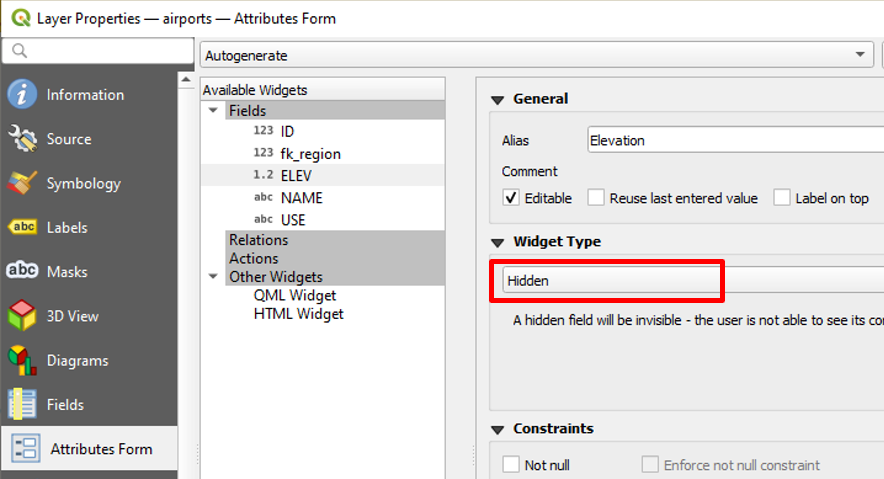
Layer > Properties > Attributes Form > Fields > Alias - Hide fields you don't want to appear in your popups by changing their Widget Type to "Hidden"
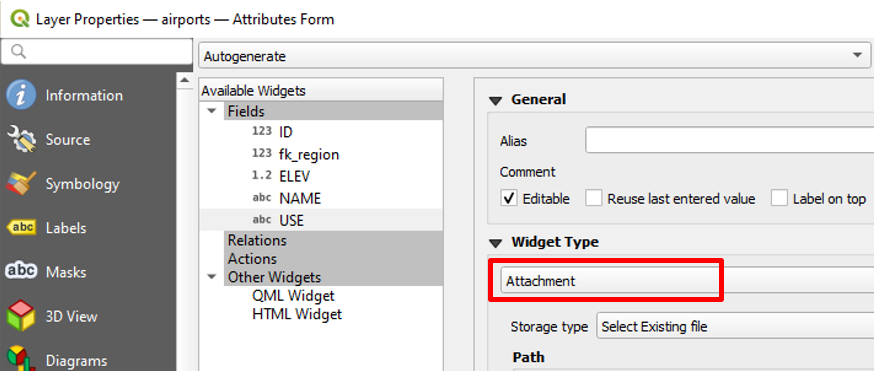
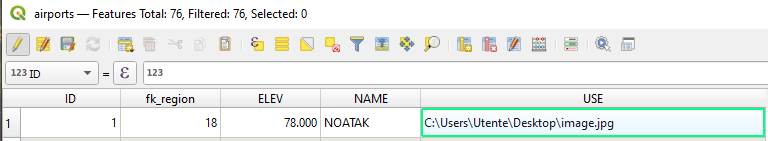
- Show media in your popups by changing their Widget Type to "Attachment" (your fields must contain image's path)
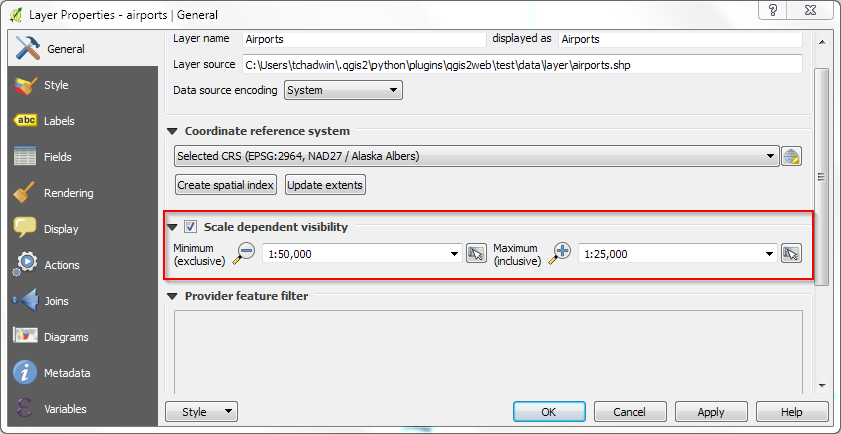
- Style your layers as explained in this wiki, and set their scale-dependent visibility, if required
Run qgis2web from the Web menu, or via its icon in Web toolbar
The panes lets you set options to export your map. All options are written to your QGIS project, so save your project if you want to keep these settings.
When you first start qgis2web, you will see a preview of your webmap in the plugin's dialog box.
This preview does not update automatically when you change settings within the dialog. Click Update preview to see your changes *
When you switch output format, by changing selection between OpenLayers and Leaflet, the preview does automatically update.
* You can disable the initial automatic preview on the Settings tab
** The preview window will automatically be disabled if you have a layer with more than 1000 features
Best Practices
QGIS Desktop and web mapping technologies such as OpenLayers or Leaflet are very different technologies. It is hardly possible to create a 1:1 copy of all desktop features for the web. Manual post-processing of the exported code may therefore be necessary for complex requirements.
Project settings section of this wiki explains how to configure your QGIS project.
qgis2web settings section of this wiki explains how to configure the plugin's settings for an optimal export.
Geometry simplification: qgis2web provides a built-inPrecision setting in the Export tab (scale 1–15; 1 = most aggressive simplification).
For polygons, a value of 5 is a good starting point. The QGIS Simplify tool can also be used for pre-processing. A slight loss of detail is usually
invisible on the web but significantly improves load time. Attribute pre-calculation: Instead of computing colours or rotations during web export, use the field calculator to create fixed columns (e.g. `web_color`, `rotation`). Select these fields directly in the plugin for styling. This reduces JavaScript processing load for the end user.
Manual feature sorting: Since web maps often ignore symbol levels, sort the layer permanently before exporting. Features at the end of the attribute table are typically drawn on top (Z-order). Use the
Permanent sort (or Sort) tool in the Processing Toolbox.Raster fallback for complex symbols: If a style cannot be reproduced (e.g. very specific textures or artistic lines), export that layer from QGIS as a raster image (GeoTIFF) and include it as a raster layer. This preserves the appearance completely.
Export large datasets as PBF Vector Tile: Very large vector datasets are not suitable for classic GeoJSON export. You can now export them as
PBF Vector Tile (heavy layer) (MVT format). For each layer, set Zmin (minimum zoom level — typically 3–8) and
Zmax (maximum zoom level — typically 8–16) to control the tile pyramid size. Higher ranges produce more tiles and may significantly
increase export time and storage but the resulting web map will load instantly at startup since only the tiles needed for the current view are fetched on the fly. Note: when PBF Vector Tile is enabled,
Layer Search and Attribute Filter are automatically disabled for that layer.
Project settings
Set QGIS project
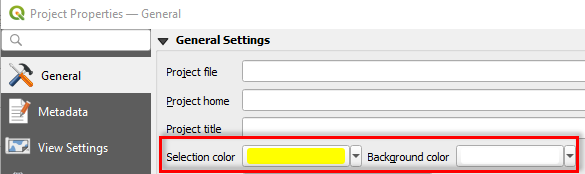
In QGIS, open Project > Project Properties... > General. The following settings will affect your webmap:
Selection colorBackground color
and open Metadata. The following settings will affect your webmap:
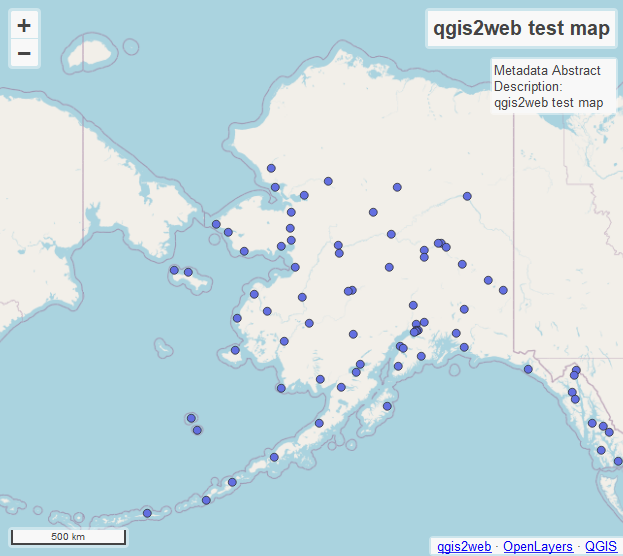
TitleAbstract
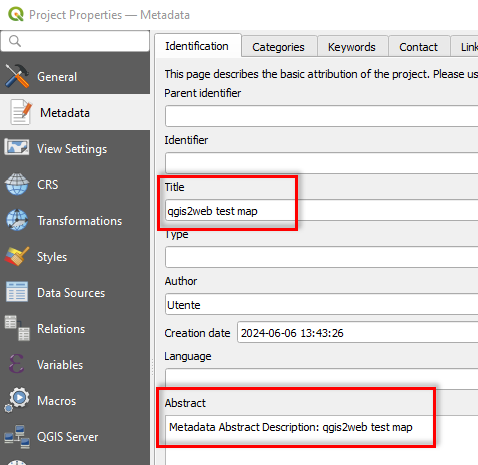
Project title and Project abstract are visible in your exported webmap; they can be positioned upper left, upper right, bottom left or bottom right
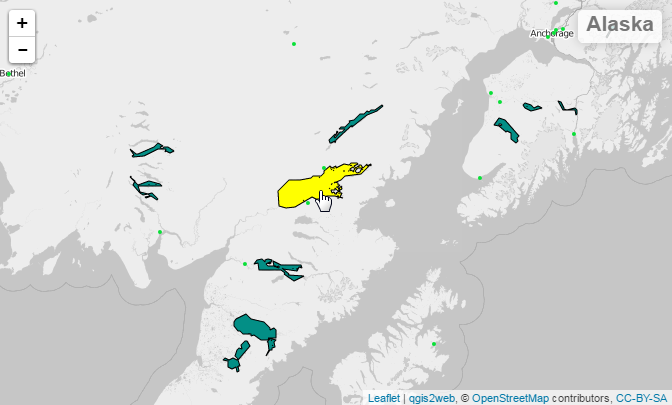
Selection color is used as the highlight colour if Highlight on hover is checked:
Set Layers
Limitations
Single quotes
'and double quotes"are technically supported but should be avoided.
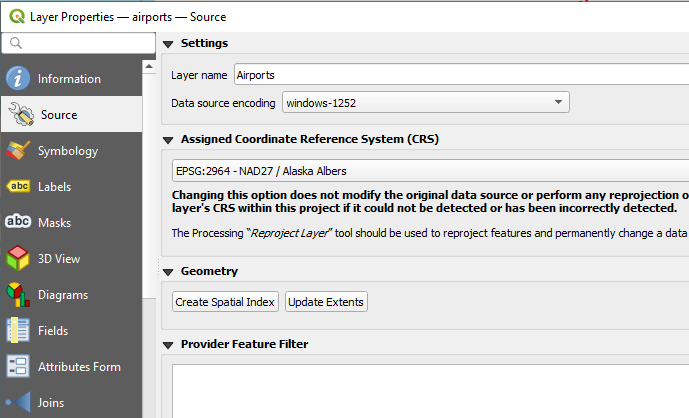
Give your layers human-friendly names in Layer properties > Source
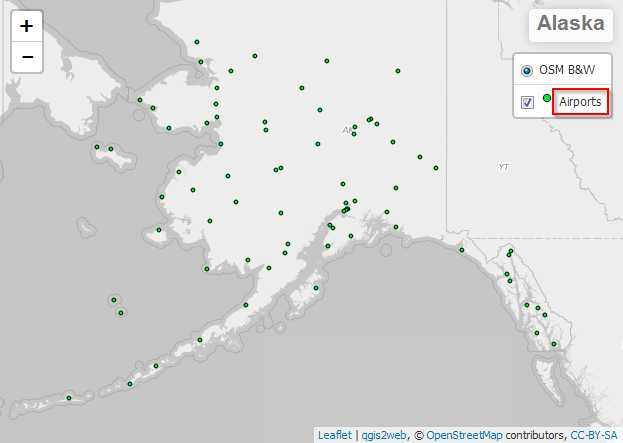
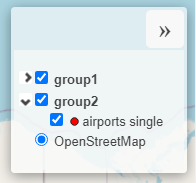
These will appear in your map's Layer list , grouped or not :
Set your layers' scale-dependent visibility, if required:
Alias
Give your layer fields human friendly names via Layer > Properties > Attributes Form > Select Field > Alias
Hidden Fields
Hide the field if you don't want to export it, by changing their Widget Type to "Hidden". As a result, the information will not export and not appear in the popup:
Media (Image, Audio and Video)
If you want to show images or audio or video in popup you must set Widget Type to "Attachment" and do not change other values.
Only the Absolute path is supported :
Set the absolute path as the field text:
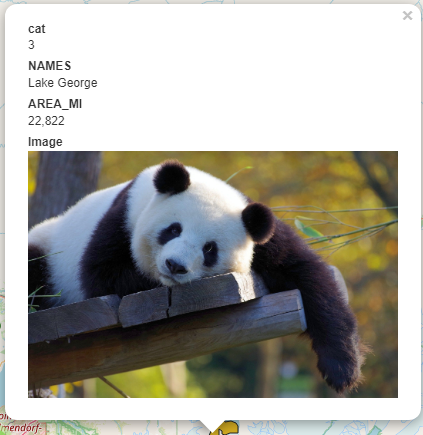
The result in your map will look like this
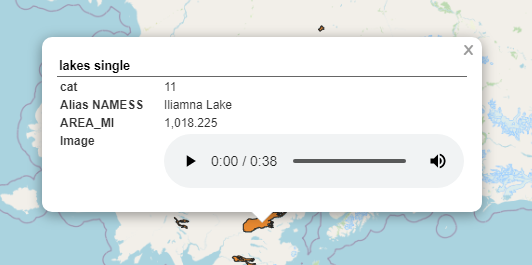
or this, for audio
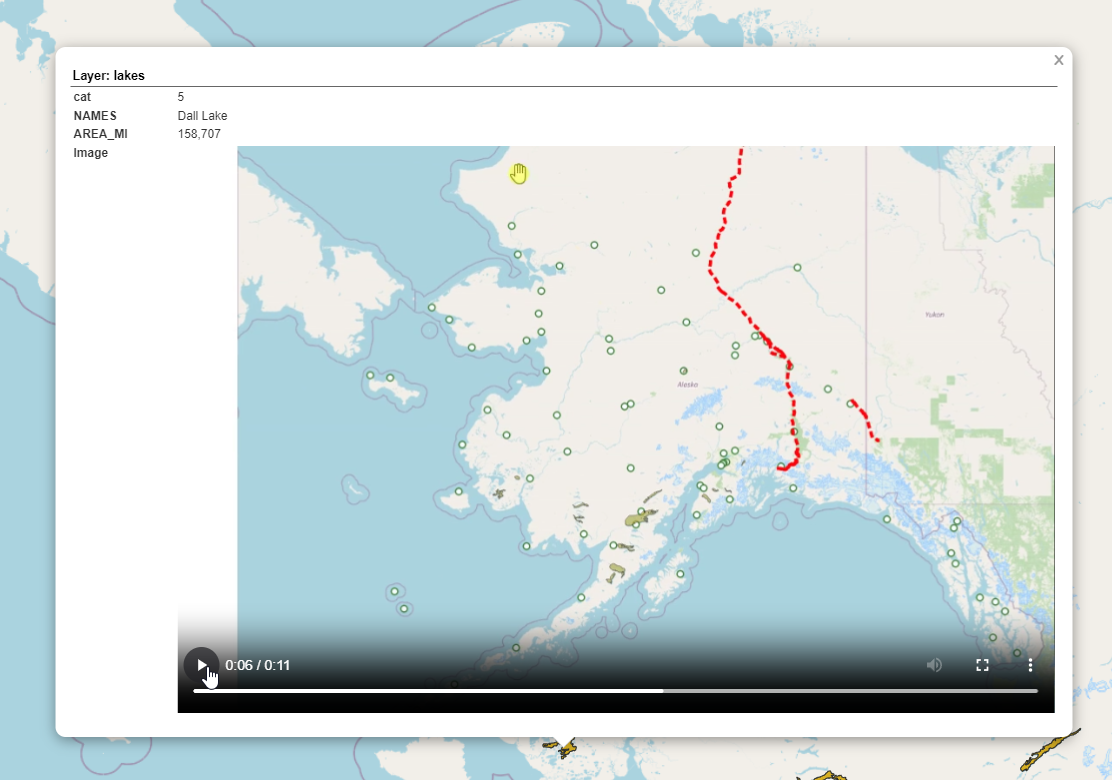
or this, for video
Attach documents
To attach documents and open them in another browser window, create a text field in your layer and write a string like this:
<a href="NTA_ENTE.pdf" target="_blank">NTA_ENTE.pdf</a>
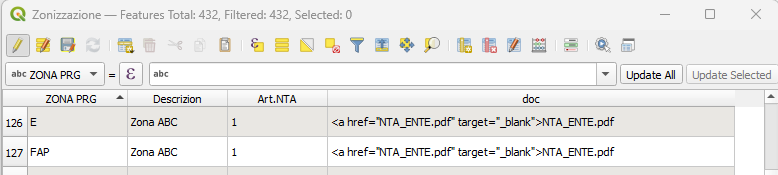
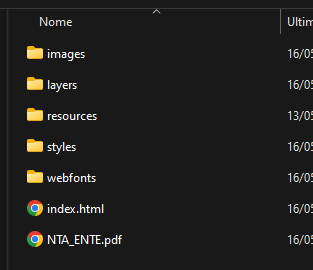
Insert your document into exported folder
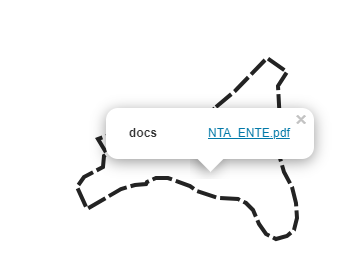
Popup will show the link as clickable and when clicked it will open a new browser tab showing Document (for supported format), or Download it
Set Styles
Limitations
- Rule-based symbology is exported in principle, but is error-prone and should always be verified with a test.
- Diagrams are not supported. Special renderers such as Geometry Generator and 2.5D symbology are not correctly translated into web code and are sometimes reduced to simple symbols. Heatmaps are only partially supported and depend on the export engine.
- Symbol levels are supported in OpenLayers; in Leaflet they are not reliably supported.
No symbol
Data will not be drawn on the map. Useful if you want to show only labels.
Single symbol
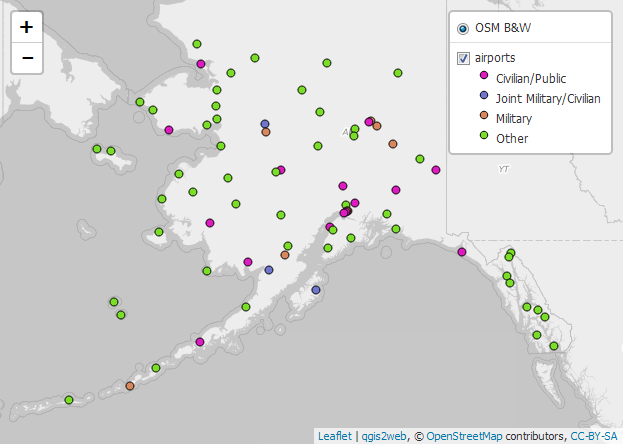
Categorized
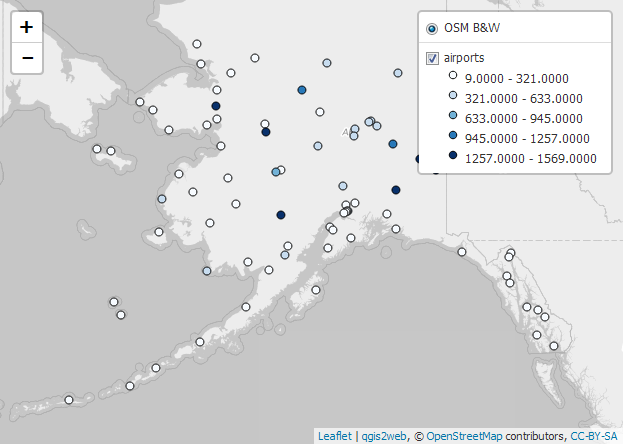
Graduated
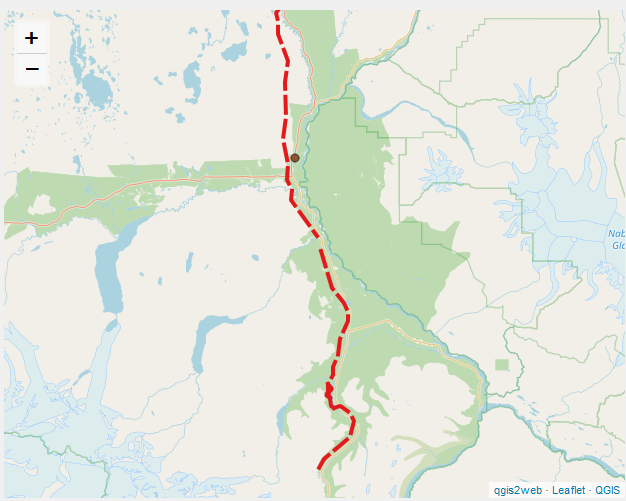
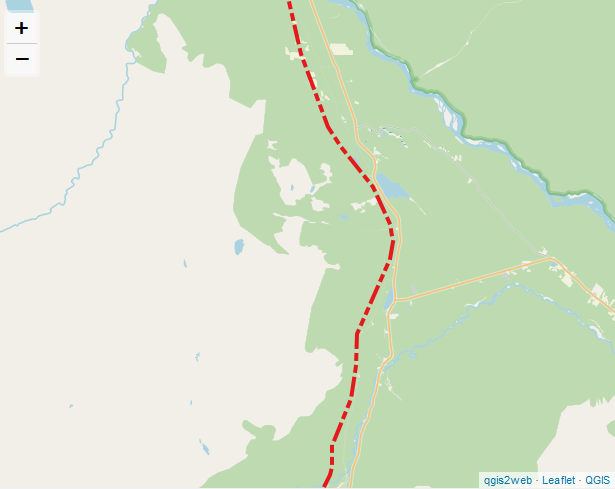
Dash Line
Dot Line
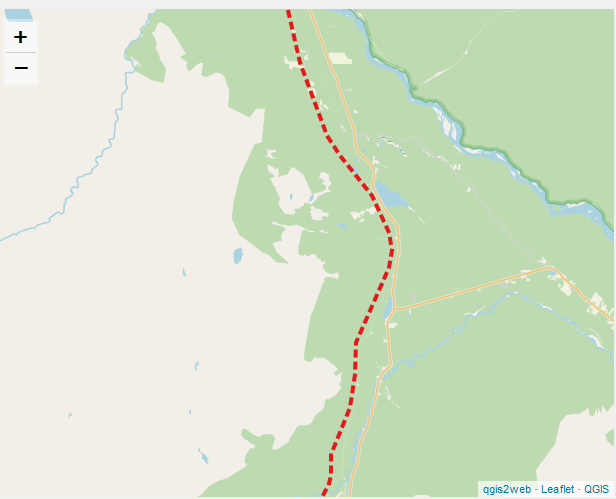
Dash Dot Line
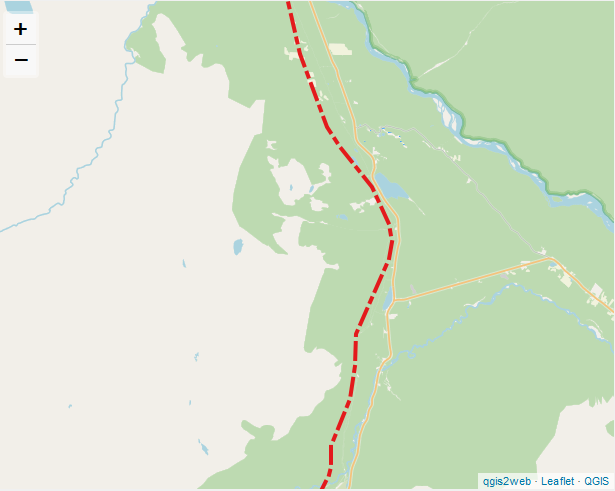
Dash Dot Dot Line
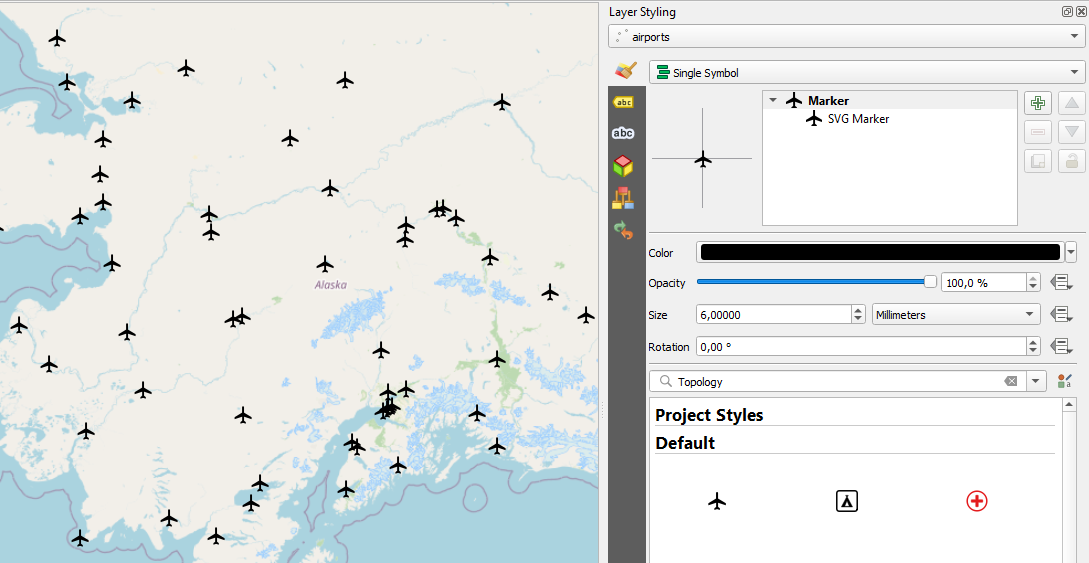
SVG Marker (for point layers only)
Supported customization:
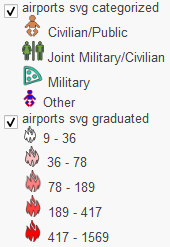
 SVG Categorized or Graduated
Supported customization for all svg's in simbology:
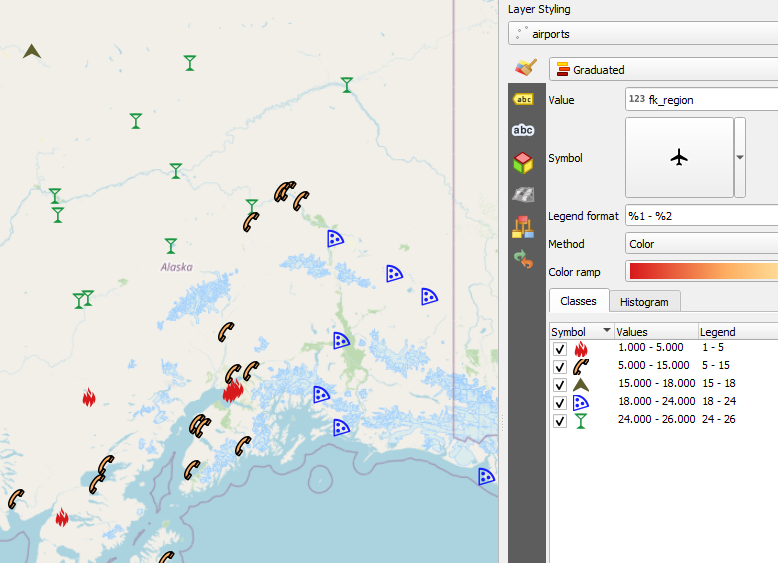
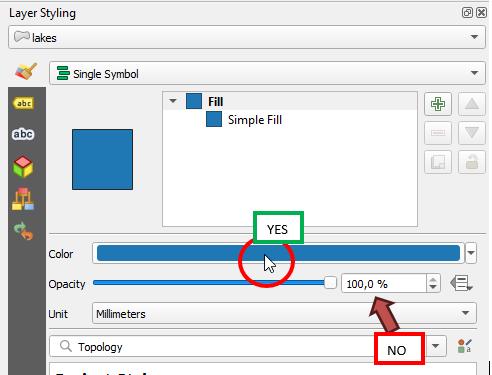
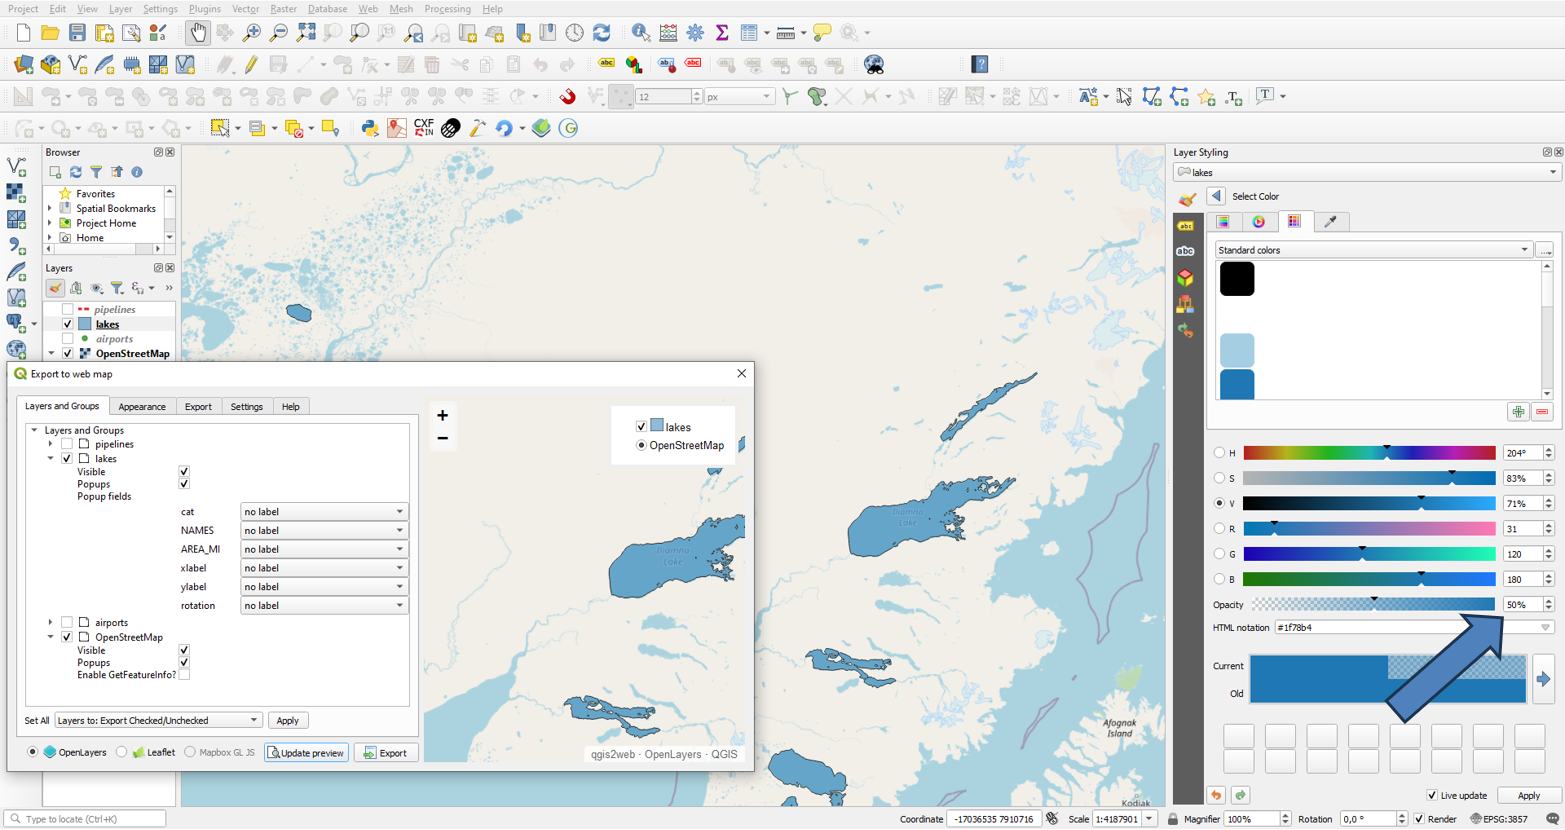
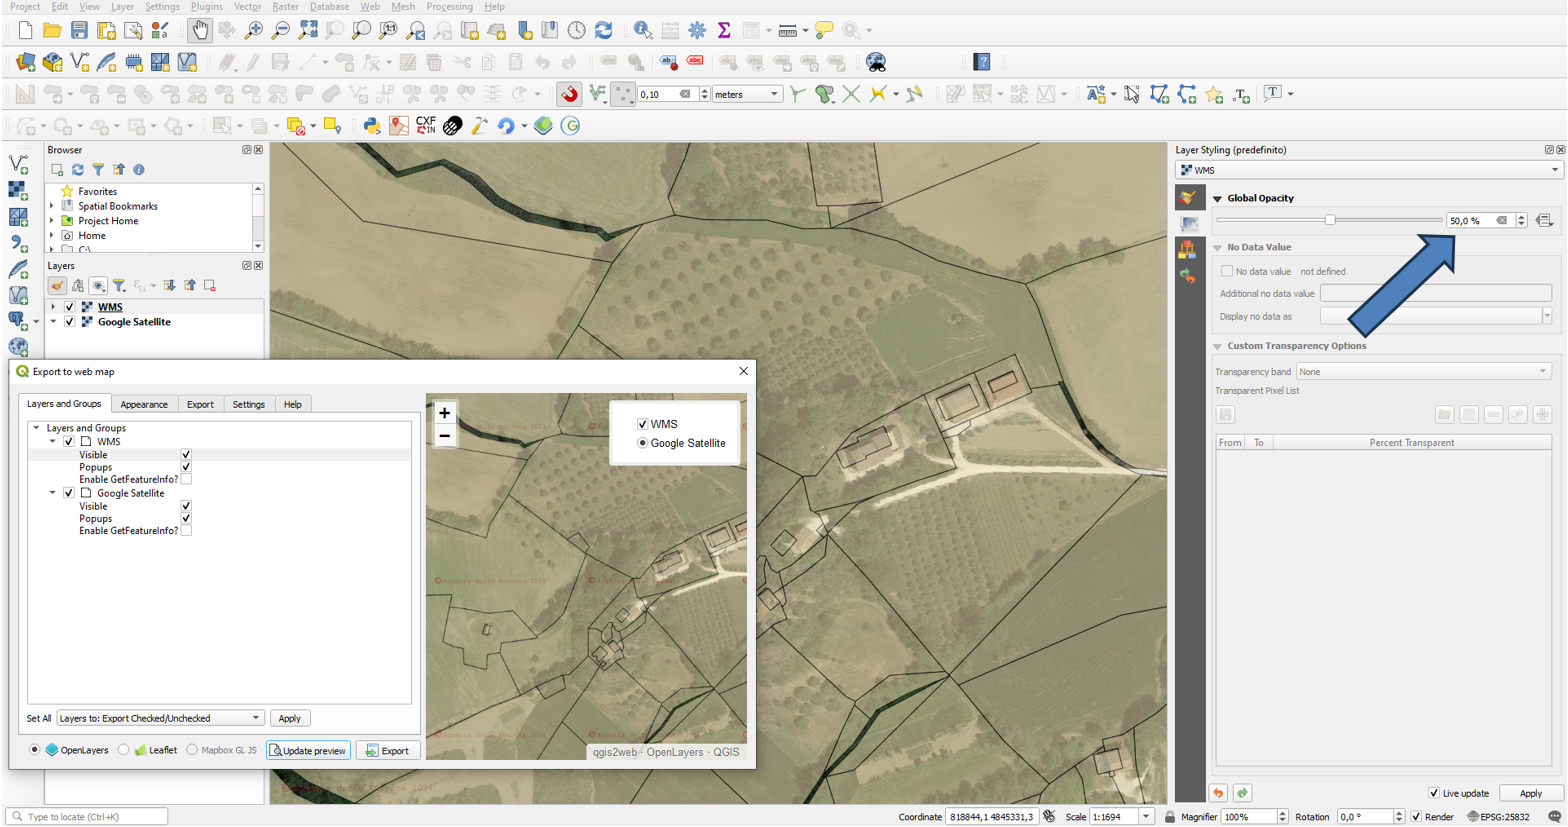
Transparency
Vector Layer
Change color's opacity, not layer's opacity
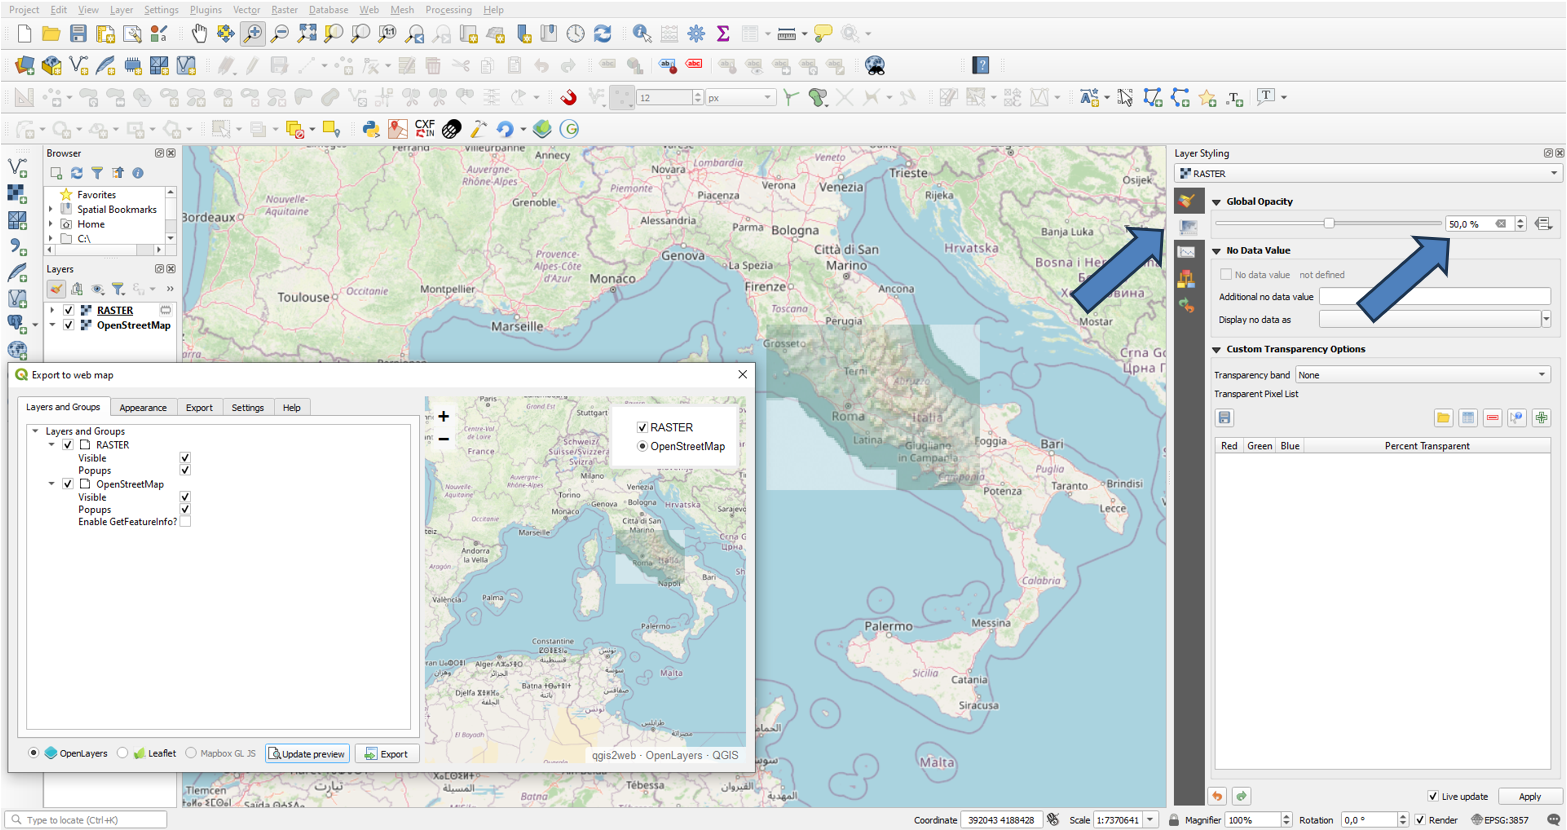
Raster Layer
WMS Layer
Set Labels
Limitation
- The plugin only exports the information about which font should be used, not the font file itself.
The end user's browser must have the font installed locally, or it must be embedded manually.
Tip for embedding: Copy the following link into the<head>ofindex.htmland update the font name in the export's CSS file to'Roboto', sans-serif;:
<link href="https://fonts.googleapis.com/css2?family=Roboto" rel="stylesheet">
- Simple expressions (e.g. concatenating field values) are supported. Complex QGIS functions (such as aggregate functions) and data-defined overrides for size, colour, or rotation are often ignored or incorrectly translated during export.
- Rule-based labelling is not supported.
Layers labelled in QGIS will be labelled in your webmap. The following formatting will be exported:
- Text > Font size
- Text > Font colour
- Text > Typeface
- Text > Bold
- Text > Italic
- Buffer > Draw text buffer
- Placement Mode > Offset from point (9 quadrants and offset)
- Rendering > Overlapping labels > Allow Overlaps (always show all labels)
- Placement > Repeating labels (for lines)
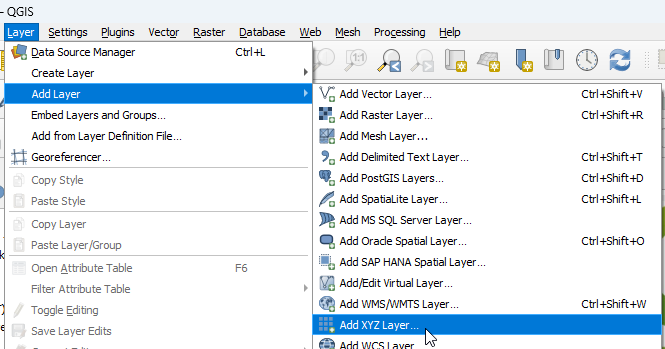
Set Basemaps using XYZ Tiles
Basemaps (XYZ tiles) are normally only available in EPSG:3857 (Web Mercator).
As of QGIS 3.0 and qgis2web 3.0 basemaps are now handled through the XYZ Tiles data source in QGIS.
Basemap Sources:
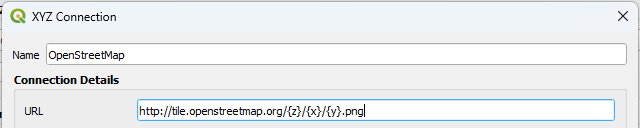
OpenStreetMap (doesn't work locally -403r error-, requires a web server)http://tile.openstreetmap.org/{z}/{x}/{y}.png
OpenFreeMap (works locally, see OFM Trick)
https://tiles.openfreemap.org/natural_earth/ne2sr/{z}/{x}/{y}.png
OpenTopoMap
https://tile.opentopomap.org/{z}/{x}/{y}.png
Google Hybrid
https://mt1.google.com/vt/lyrs=y&x={x}&y={y}&z={z}
Google Satellite
https://mt1.google.com/vt/lyrs=s&x={x}&y={y}&z={z}
Google Road
https://mt1.google.com/vt/lyrs=m&x={x}&y={y}&z={z}
XYZ Tiles can be accessed from menù on top:
Then put in a name for basemap and the aforementioned URL
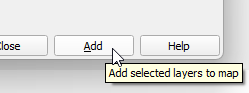
Then click to "add" to put in Map
OpenFreeMap Trick
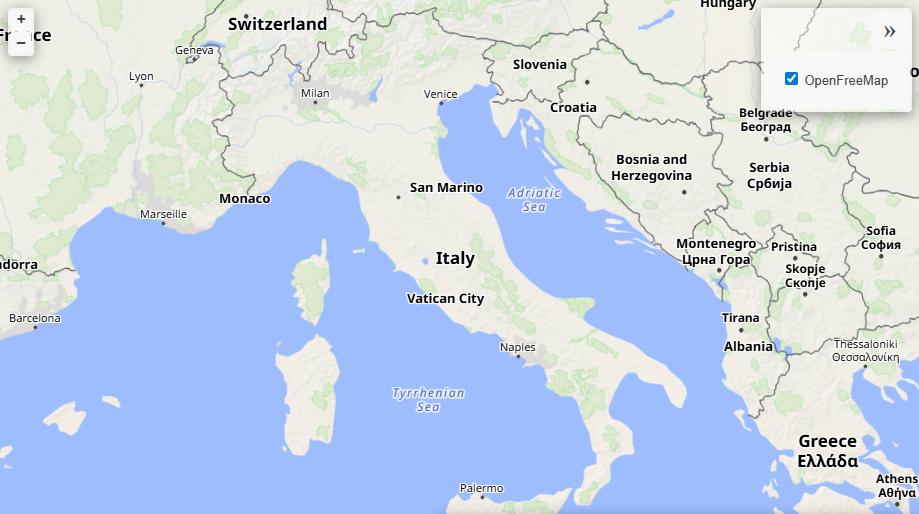
OpenFreeMap is composed of 3 different layers: a background, a vector, and a label layer. To make OFM work in the exported webmap, simply load only the XYZ layer described above into QGIS. The webmap will display a group containing the 3layers (which are not visible).
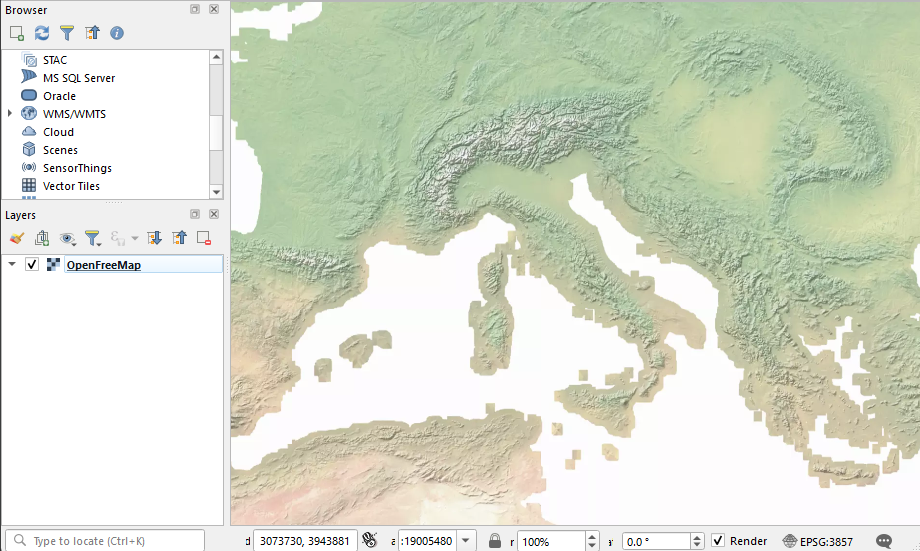
In QGIS, only the XYZ background layer will be visible:
But in the webmap, you will see a complete data
qgis2web settings
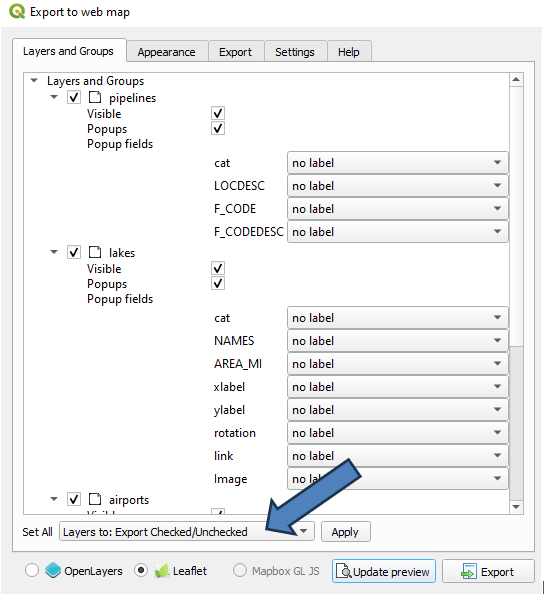
Layers and Groups
"Set all" input
The settings shown on this page can be set massively for all layers using the "Set all" input. The entries dedicated to the checks first insert them all, then remove them, then insert them etc...
Export Layers
When you launch qgis2web all activated layers in your qgis project will be checked as exportable. If you want to export all the layers of your project, turn them on before launching qgis2web or use the "Set all" input
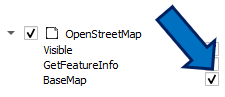
Visible
Select whether the layer will be visible on map load. This only determines visibility - the layer will be loaded regardless of this setting:
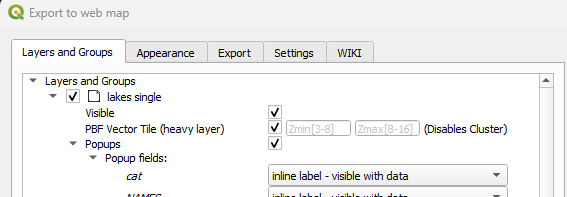
PBF Vector Tile (heavy layer)
Export the layer as Mapbox Vector Tiles (MVT / .pbf) instead of GeoJSON. This option is designed for large datasets that would be too slow or too large as GeoJSON.
Zmin— minimum zoom level at which tiles are generated (e.g. 3). Lower values = more tiles.Zmax— maximum zoom level (e.g. 8–16). Higher values = more tiles and longer export time.- Disables
Cluster(incompatible),Layer SearchandAttribute Filter. - Labels and Popups are supported via a companion GeoJSON overlay on top of the vector tile layer.
- The exported map requires a local HTTP server to serve the .pbf tiles (a launcher script is provided).
Popups
Select whether a layer should show a popup and respond or whether the layer should not listen to click events.
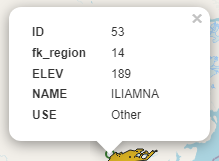
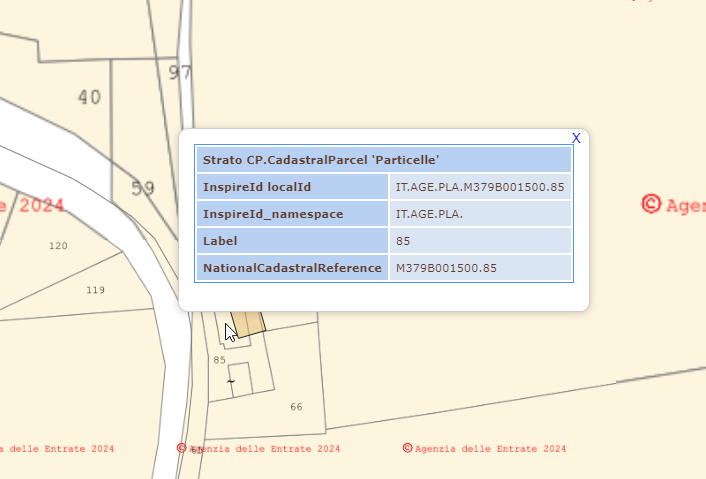
OpenLayers popup will show all features information present in a click point, showing layer's name relating to queried feature
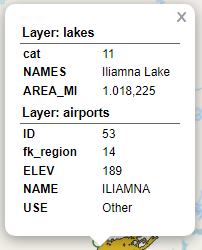
Leaflet popup will only show information for one feature at a time
Popup fields
Specify how each field will be labeled in pop-ups
 |
 |
 |
| no label | inline label | header label |
The options will have the following result in the popup:
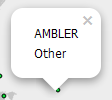
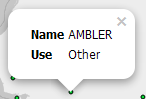
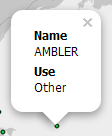
no label(displays only data in the popup without showing the field name)inline label - always visible(displays field name on the same line as data)inline label - visible with data(displays field name on the same line as data, only if data is present)hidden(keeps information in the popup hidden at all times)header label - always visible(displays field name above data)header label - visible with data(displays field name above data, only if data is present)
Encode to JSON
If unchecked, WFS layers will remain remote WFS layers in the webmap. If checked, the layer will be written to a local GeoJSON file
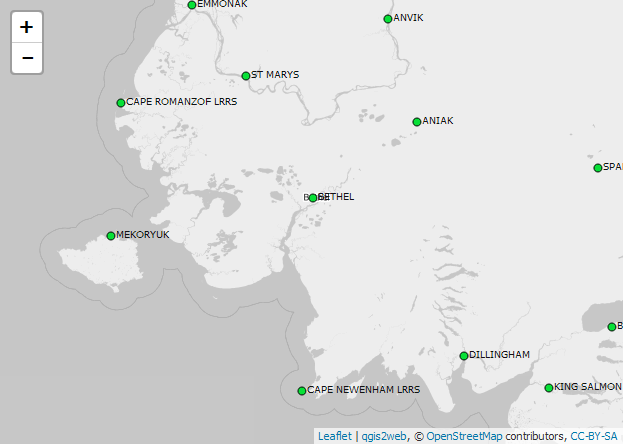
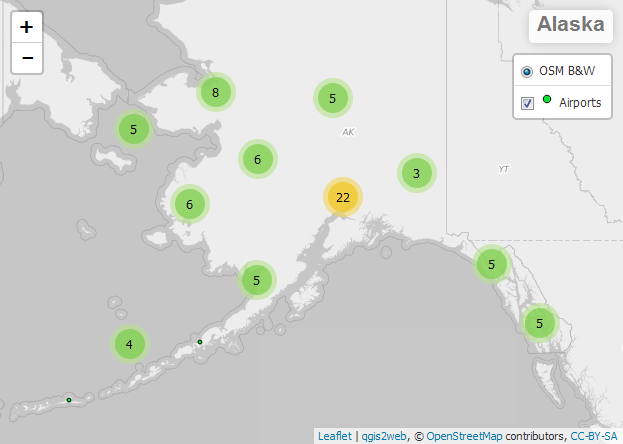
Cluster
Cluster point features:
GetFeatureInfo
If checked, the wms layers will be queryable with popup
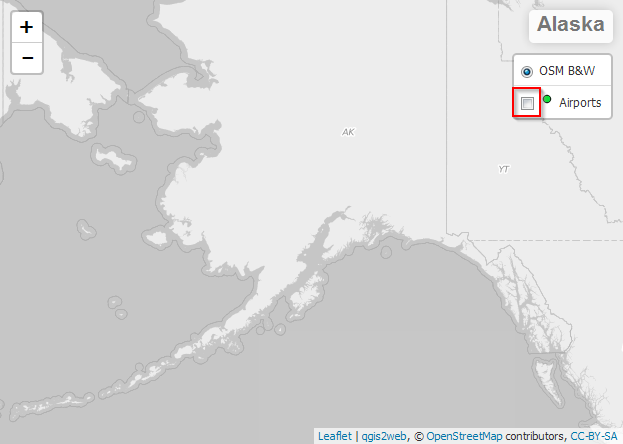
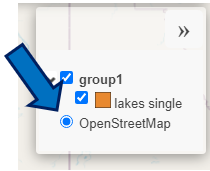
Basemap
Option visible only for raster, xyz and wms layers. If checked the layer will be visible in the LayersList with a radio button, not with a checkbutton.
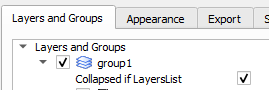
Group
If you have organized your layers into groups you will find them in the interface.
There is an option "Collapsed if LayersList" that is automatically enabled if your group is collapsed in the QGIS layer list. The option reflects the group's status in the LayersList, if it is visible.
Appearance
Title
Add a info window in the webmap which shows the projects title
Abstract
Add a collapsible info window in the webmap which shows the projects metadata abstract
Layers list
Include list of layers (with legend icons, where possible)
Attribute Filter
Only for Leaflet export: Allows you to choose multiple fields and will show the graphical possibility of filtering the data visible on the map
Geolocate user
Show user's location on map
Note: Chrome now blocks geolocation unless your map is hosted securely (HTTPS)
Measure tool
Include interactive measuring widget - choose metric or imperial units
Address search
Add field to allow searching for address locations (geocode)
Layer search
Add option to search for values in layer field values, also in cluster
Note: Layer search does not work in leaflet export if a point layer with symbols other than circle is usedShow popups on hover
Show popups when mouse hovers over features
Highlight on hover
Highlight features on mouseover
Template
Select HTML template for webmap - add your own templates to /qgis2web/templates directory in your current QGIS3 profile folder
Widget Icon
Choose controls main color
Widget Background
Choose controls background color
Match project CRS
By default, the web map is exported in EPSG:3857. Using the "Match project CRS" option, the project CRS can be retained instead.
Restrict to extent
Prevent panning or zooming beyond the selected extent
Extent
Either match the current QGIS view or show all contents of all layers (only local GeoJSON and rasters, not WFS/WMS)
Max zoom level
How far the webmap will zoom in
Min zoom level
How far the webmap will zoom out
Export
Export folder
The folder where the webmap will be saved
Exporter
How your map will be exported - currently supported are `Export to folder` and `Export to FTP site`: Click the `...` button to configure the export settings
Minify GeoJSON files
Remove unnecessary whitespace from exported GeoJSON to reduce file size
Precision
Simplify geometry to reduce file size. Note that 1 is the most aggressive simplification and 15 the least, for polygons a setting of 4 is probably about the right compromise between data size and quality
Bug
Reporting bugs
Please report any problems you have with qgis2web. Without this feedback, I am often completely unaware that a problem exists. To ensure no time or effort is wasted in bug reporting, please follow these steps:
- Make sure you are using the latest release of qgis2web
- Check the issues on Github to see whether the bug has already been reported, and if so, read through all the comments on the issue, and add any additional information from your experience of the bug
- Make sure you can reproduce the bug reliably
- Reduce the complexity of your bug conditions as far as you can, especially by reducing the number of layers, ideally to one
- Raise a Github issue in
github.com/qgis2web/qgis2web/issues, including:- only one bug per Github issue
- the qgis2web version (or make it clear you are using Github master branch)
- any Python error text/stack trace which occurs
- browser JS console errors - press F12 in qgis2web to open the developer toolbar and find the console
- screenshot of your settings
- screenshot of the output
- a link to the data you used, if possible
The stability of qgis2web relies on your bug reports, so please keep them coming.